7 min readOriginally on LinkedIn ↗
Graphs for beginners
This article consists of the topic “Graph” in our Data Structures subject.
In order for you to understand the program that we have created, we shall first teach you the different kinds of graph and the things related to it.
Fundamentals
A graph consists of a set of vertices (or nodes) and a set of edges (relations) between the pairs of vertices. The edges represent paths or connections between the vertices. Each edges is a set of two (2) vertices.
Example of a graph:
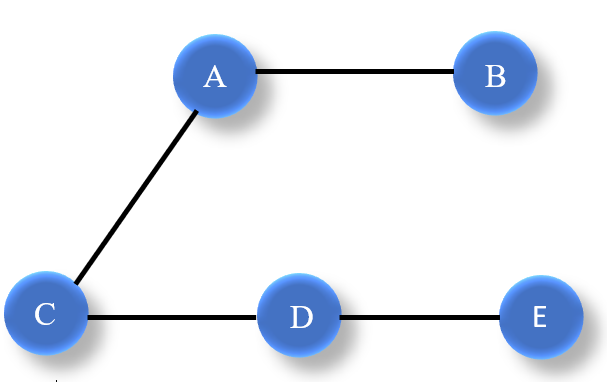
Based on the above graph, the sets of vertices (V) and edges (E) are as follows:
V = { A, B, C, D, E}
E = {{A,B}, {A,C}, {C, D}, {D, E}}
A digraph (directed graph) consists of edges each connected to a single vertex. Directed edges are lines with an arrow on one (1) end.
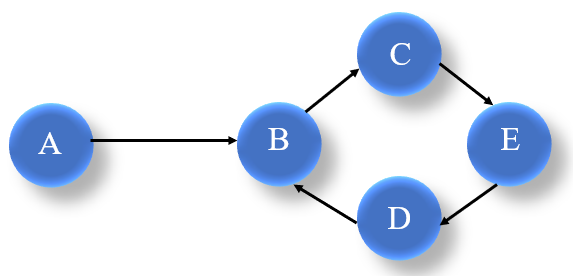
Hence, the set of edges is:
E = {{A, B}, {B, C}, {C, E}, {D, B}, {E, D}}
A weighted graph consists of edges that are associated with values.
A vertex is adjacent to another vertex if there is an edge to it from that other vertex.
Based on Figure 1, (1) A is adjacent to B and C; (2) C is adjacent to A and D; and (3) D is adjacent to C and E.
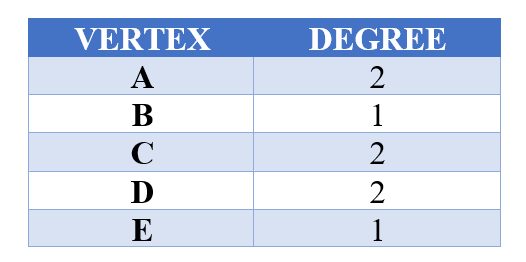
The degree of a vertex is the number of edges which has that vertex as an endpoint. Sample table of degrees (based on Figure 1):
A path is a sequence of adjacent vertices. Based on Figure 2, the path from A to D is A-B-C-E-D.
Graph Representation
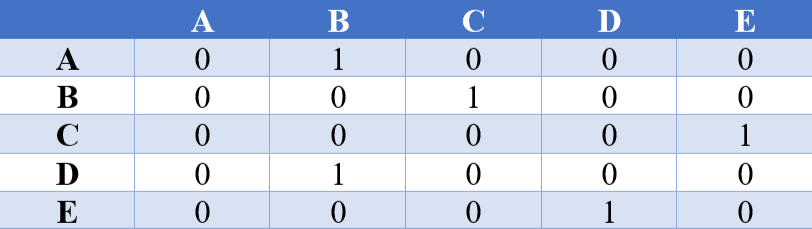
An adjacency matrix is a square matrix with dimensions equivalent to the number of vertices in the graph. It is used to indicate whether pairs of vertices are adjacent or not.
The elements of the matrix typically have values ‘0’ or ‘1’. A value off ‘1’ indicates adjacency between the vertices in the row and column.
Adjacency matrix for an undirected graph (based on Figure 1):
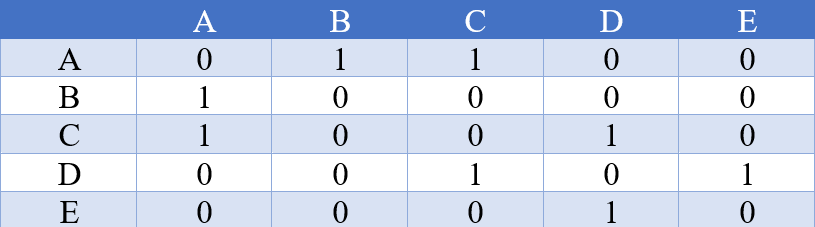
Adjacency matrix for a directed graph (based on Figure 2):
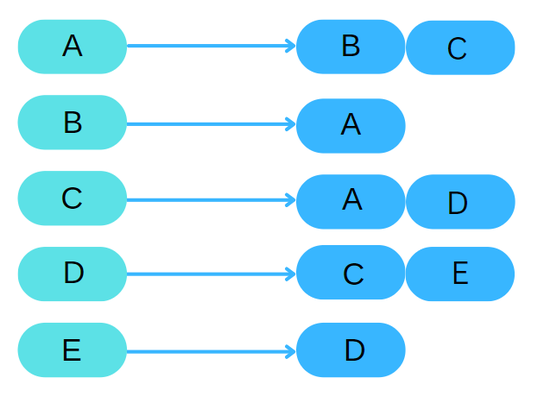
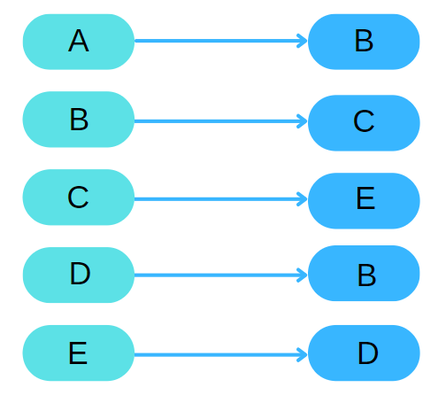
An adjacency list uses an array of lists to represent a graph. There is one (1) list for each vertex.
Our Program:
Rainbow_Color

About our program
The program that we have created shows the adjacency list of a given graph based on the ROYGBIV or the proper rainbow color.

Now that you have determined the proper placement of the colors in a rainbow we should show you the conversion of it on a graph.
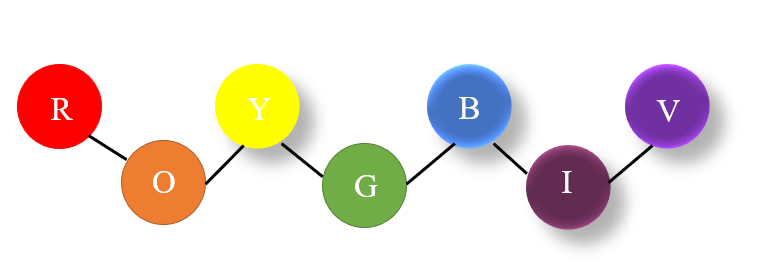
Take note that R represents red, O for Orange, Y for yellow, G for green, B for blue, I for indigo and V for violet.
Program
Here is the code for the program that we have created.
Code:
import java.util.ArrayList;

public class RainbowColorList {

 public static void main(String[] args) {

  char Red = 'R';      //represents the color of rainbow or ROYGBIV
  char Orange = 'O';
  char Yellow = 'Y';
  char Green = 'G';
  char Blue = 'B';
  char Indigo = 'I';
  char Violet = 'V';


  ArrayList<ArrayList> adjList = new ArrayList<>();
  char[] vertices = {'R', 'O', 'Y', 'G', 'B', 'I', 'V'};
  int no = 7;

  for (int i = 0; i < no; i++) {
   adjList.add(new ArrayList<>());
  }


  adjList.get(0).add(Orange);
  adjList.get(1).add(Red);
  adjList.get(1).add(Yellow);
  adjList.get(2).add(Orange);
  adjList.get(2).add(Green);
  adjList.get(3).add(Yellow);
  adjList.get(3).add(Blue);
  adjList.get(4).add(Green);
  adjList.get(4).add(Indigo);
  adjList.get(5).add(Blue);
  adjList.get(5).add(Violet);
  adjList.get(6).add(Indigo);


  int v = 0;
  for(int i = 0; i < no; i++, v++) {
   System.out.println(vertices[v] + ": " + adjList.get(i));
  }

 }

}
Output:
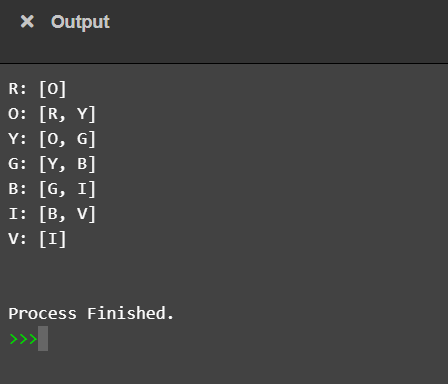
In order for you to understand the code we will explain it to you how each line contributes to the actual output of the program.
import java.util.ArrayList;

public class RainbowColorList {

 public static void main(String[] args) {

  char Red = 'R';      //represents the color of rainbow or ROYGBIV
  char Orange = 'O';
  char Yellow = 'Y';
  char Green = 'G';
  char Blue = 'B';
  char Indigo = 'I';
  char Violet = 'V';
The import java.util.ArrayList; contains the ArrayList class, a resizable array. The difference between a built-in array and an ArrayList in Java, is that the size of an array cannot be modified (if you want to add or remove elements to/from an array, you have to create a new one).
The public static void main(String[] args)is the main method. Is the first Java programming method you encounter because it serves as the starting point for a Java program’s execution. Any class that is a part of a program may contain the main method, which can contain code to run or call other methods.
These codes represent the colors of the ROYGBIV in char type variables:
char Red = ‘R’; char Orange = ‘O’; char Yellow = ‘Y’; char Green = ‘G’; char Blue = ‘B’; char Indigo = ‘I’; char Violet = ‘V’;
We have made the first letter of their color names so that you will understand the graph easier based on the graphs you have seen above.
ArrayList<ArrayList> adjList = new ArrayList<>();
  char[] vertices = {'R', 'O', 'Y', 'G', 'B', 'I', 'V'};
  int no = 7;

  for (int i = 0; i < no; i++) {
   adjList.add(new ArrayList<>());
  }
The ArrayList<ArrayList> adjList = new ArrayList<>(); is used to create an Arrayy list object. The arraylist inside the < > represents that the contents of the array is based on the variable itself.
The char[] vertices = {‘R’, ‘O’, ‘Y’, ‘G’, ‘B’, ‘I’, ‘V’}; represents the starting color of each respective names. This would be later used as a reference of the vertices inside the graph.
The int no = 7; is a integer variable that would be used as a count for the for loop next to the code. It also represents the number of colors in the rainbow.
The for (int i = 0; i < no; i++) is an parameter of expressions that represent the following: int i = 0is executed before the execution of the code block. i < nodefines the condition for executing the code block.i++ is executed (every time) after the code block has been executed.
  adjList.get(0).add(Orange);
  adjList.get(1).add(Red);
  adjList.get(1).add(Yellow);
  adjList.get(2).add(Orange);
  adjList.get(2).add(Green);
  adjList.get(3).add(Yellow);
  adjList.get(3).add(Blue);
  adjList.get(4).add(Green);
  adjList.get(4).add(Indigo);
  adjList.get(5).add(Blue);
  adjList.get(5).add(Violet);
  adjList.get(6).add(Indigo);
These code of line represents the arrangement of the adjacency list of the given rainbow color graph. We could take adjList.get(0).add(Orange); as an example, adjList calls out the array list that we have created earlier while the get(0) represent a command to get the value of the first line inside the array list. And add(Orange) states that the number 0 inside the list should have the value of Orange which is “O”.
int v = 0;
  for(int i = 0; i < no; i++, v++) {
   System.out.println(vertices[v] + ": " + adjList.get(i));
The int v = 0; will serve as a stopper for the loop given below it
The for(int i = 0; i < no; i++, v++) would be the same function as the for loop above but this time there are two expressions that should be done once the loop has finished.
The System.out.println(vertices[v] + “: “ + adjList.get(i)); repesents the output of the program itself. The vertices[v] should output the given char value of the list based on the number of the int v. The adjlist.get(i) represents the callout of adjList given above and it should get the value of it based on the value of int i above.
Conclusion:
Based on the program that we have created and the topic that we have selected, we have concluded that graphs and charts are effective visual tools because they present information quickly and easily. Therefore, it is not surprising that print and electronic media frequently use graphs. Sometimes, data can be better understood when presented by a graph than by a table because the graph can reveal a trend or comparison.

On the program that we have created we can say that we are happy since it applies the very concept of the graph inside this topic and we can use this as a practice for future programs that may need a graph to present an information. Thankyou for reading my article : )